Extracting a social graph from Wikipedia people pages
April 5th, 2012 | Published in data, graphs
I’ve been in San Francisco this week giving a workshop at the Where Conference called Prototyping Location Apps With Big Data. You can read the full slides for the workshop on Slideshare and get the full code and sample data on Github.
The key message of the workshop is that there are plenty of open datasets available on the web which can be used to prototype new applications by acting as proxies for the kind of data you expect to have later in the product lifecycle. You just have to do a bit of lateral thinking and some data-processing. For example, wouldn’t it be great if you were working on a social site and could test your designs, your algorithms and your scalability using a realistic social graph of 300,000 people with over 2 million connections between them? It’d be much better than entering a test dataset by hand using just a few examples from people you know or your family, and it’d make for a much better demo if you took it to an investor or a product board. No more lorem ipsum!
We can generate such a dataset using Wikipedia. Consider the Wikipedia page for Bill Clinton. In just the first three paragraphs there are mentions of people highly related to the former US President: Hillary Clinton, George H.W. Bush and Franklin D. Roosevelt. If we were to consider these intra-wiki links as connections in the social graph (“Bill Clinton knows Hillary Clinton”) and perform this extraction over all of Wikipedia then we’d have a pretty convincing graph. It would have lots of connections, a good mix of communities (politicians, historical figures, television personalities) and a nice mix of well-connected and less-connected people.
Raw Wikipedia text is openly available for download but parsing it is difficult, and doesn’t give us the kind of structured and typed data that we’re looking for. Luckily the DBpedia project has already tackled this problem. They have extracted page types, images, geocoded coordinates, intra-wiki links and many other things, and made them all downloadable. For this hack we’ll need the “Ontology Infobox Types” and the “Wikipedia Pagelinks” datasets.
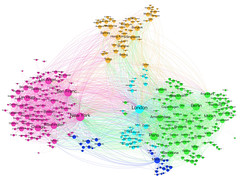
The types file has one or more lines for each Wikipedia page. For example, the page for Autism is listed as a Thing and a Disease. We’ll filter this file down to just the Person pages. Then we’ll take the links file and filter it down to just the links that are from a Person to another Person (by using the filtered types file we just made). We can do all of this with 18 lines of Apache Pig code then run it through a Hadoop cluster. You can see sample results in the Github project. If we convert it to GraphML format with a JRuby script (using the JUNG library) and load it into Gephi to detect the communities and create a force-directed layout, we get a pleasant and interesting social graph with all the kinds of clusters we’d expect:

You can also explore a simplified version of this graph in PDF format for your zooming pleasure.